Tags: Ethical Values
Jeremy Allan (Head of Programme and Operations, Ethics & Compliance) and Cornelia Baciu (Programmes Manager, Ethics & Compliance) share insights into how Johnson Matthey (JM) has used its E&C data to build a heat map that allows it to zero in on the ethical culture of its sites.
As compliance programmes mature, ethics and compliance functions are seeking to innovate and take programmes to the next level by focussing more on business ethics and improving ethical culture. When doing so, a key challenge is to be able to measure impact and develop relevant KPIs, but how do you measure culture? Is it even possible? And if so, can it be done without building huge data analytics capability and employing the processing power of supercomputers! At JM we wanted to answer these questions and challenge ourselves to do what many see as too difficult because we believed that if we could develop a way to measure ethical culture, there would be significant benefits:
- Highlight potential weaknesses based on objective criteria and challenge sites to do better (nothing like a little healthy competition!)
- Enable us to shine a light on components that might otherwise go unnoticed or be forgotten
- Develop targeted remedial measures
Perhaps some of what has stood in our way as an industry to this point is the fact there is no single way to measure ethical culture. And whilst different indicators are available to us, they are just that – an indication of culture rather than a definitive measure. Advances in data analytics have led to a host of methodologies being proposed. Unfortunately, many rely upon quite complicated data analysis and are difficult to replicate – in part because organisations might not even be able to collect the data required.
At JM we were confronted by similar issues but knew we wanted to zero in on ethical culture rapidly and not wait until we collected additional data sets specific to the task. So we surveyed the data we had already and pressed forward – recognising this was a version 1 and future iterations could follow.
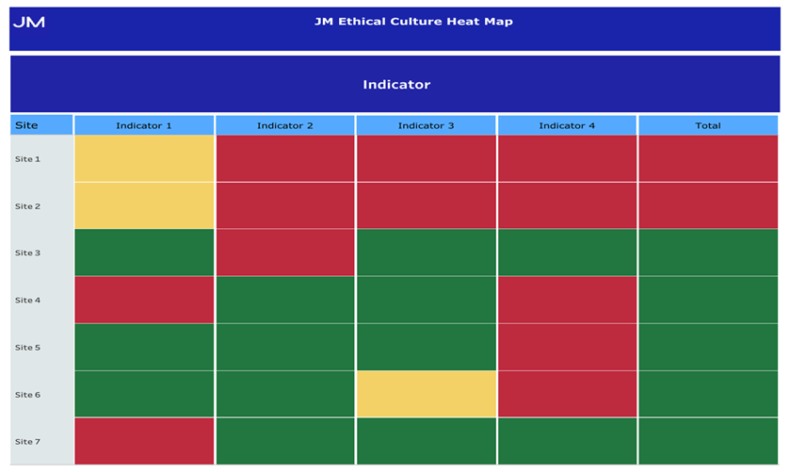
Using several indicators to build a picture of culture at each site lends itself to being represented in a heat map. This provides a simple, visual tool, showing how each indicator contributes to the overall picture. This means sites can be compared to each other and provides a focus for considering where issues might arise. The use of the heat map has been a great success in its early days. It has enabled deeper conversations around ethics and compliance and is creating ownership at the right levels of our organisation.
So where did we start? If you want to do something similar, data will be at the heart of your journey. It is tempting to think about what data you have and jump straight in. But try to take a step back and think about your objectives – what are you trying to achieve and at what level do you want to drive accountability?
At JM we wanted to provide an indication of our ethical culture at specific points in time, a tool to target our interventions and the ability to drive accountability for ethical culture at sector and site management level. Consequently, we needed indicators that provide an up-to-date view of behaviour, respond over the short or medium-term (this helps drive accountability) and are measured at site level. We also felt it was vital to get our employees’ views of the organisation’s ethical culture as a qualitative measure.
This lends itself to indicators such as:
- Speak Up volume
- Employee engagement survey (question: “I never feel pressured by my immediate manager to do things that I believe may be unethical.”)
- Specific ethical culture questions targeted to subsets of individuals at each site
- Training completion rates
You will note several indicators reach the entire employee population because ethical culture is a shared set of behaviours and not exclusive to management or other smaller populations.
So when thinking about the indicators to use, the following criteria may be useful:
- Measure of the current state
- Responds in the short to medium term
- Mix of quantitative and qualitative – qualitative should ideally include your employees’ views
- Applicable to whole employee base
It is important to keep in mind that you are not trying to meet all of these criteria with every indicator.
What next? Decide how best to treat the data and represent the outcomes. For example, a Speak Up culture is extremely important to us at JM, so the ethical culture at a site with a low number of Speak Ups can be just as concerning – if not more so – as one with a high number. Therefore, when using Speak Up data we analysed it, so a low score was generated when the actual number of Speak Ups was either significantly above or below the expected Speak Up range compared to benchmarking rates.
Something else to consider is whether you wish to assign different weightings to the indicators. We did because we believed some were stronger measures than others at this time, but that might not always be the case.
It all sounds complicated - is it? No – one of our overriding goals was to keep things simple. We believe to engage with the business we need to be able to explain what we have done and take them along with us. Consequently, we chose just four indicators – all of which have an obvious connection to an ethical culture.
By representing the information in a simple to understand heat map (see diagram 1 below) it is easy for our stakeholders to zero in on where there might be underlying issues with culture and start thinking about whether that aligns to their own experience. It is a great way of opening up the conversation and focussing your interventions.
Diagram 1: Example heat map

Authors


